“Learn how to measure product launch success using 10 key KPIs like CAC, Churn, NPS, and the Viral Coefficient, looking beyond revenue for sustainable growth.”
You did it.
The all-nighters, the endless debates over button colors, the final chaotic push. You’ve finally clicked the “launch” button. Your product is live.
Now comes the hard part. The tough part. Waiting.
You refresh the sales dashboard. Once. Twice. A hundred times. You’re glued to that revenue number, and every time it ticks up, you feel a rush of validation. When it stalls, you feel a pit in your stomach.
This is the classic founder’s trap: equating launch success with launch-day revenue.
It’s an easy mistake to make. Revenue is simple, tangible, and feels like a final score. But here’s the hard truth: Revenue is a vanity metric, especially in the early days. It tells you what happened, but it tells you absolutely nothing about why. It doesn’t tell you if your customers are happy, if your product is actually working, or if your business will even exist in six months.
A launch that generates $100,000 in its first week might be a wild success. But what if it costs $150,000 in ads to get those sales? What if 90% of those users log in once, dislike the experience, and never return? Suddenly, that “successful” launch is a five-alarm fire.
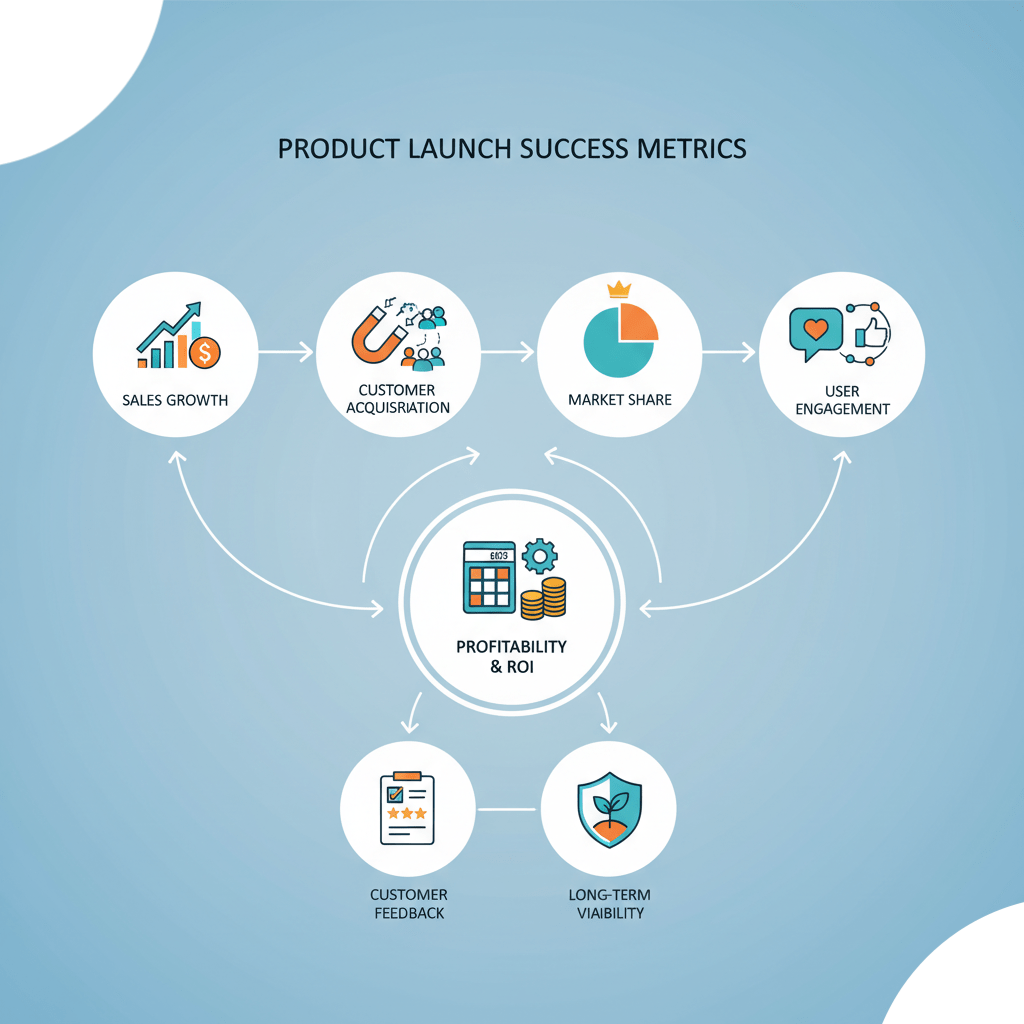
To truly understand how to measure product launch success, you need to look deeper. You need to analyze the entire picture, not just the final number on a sales report. This post-launch analysis requires a different set of product launch KPIs (Key Performance Indicators) that measure health, engagement, and sustainable growth.
Let’s explore the 10 product launch metrics that actually matter.
1. Website & Landing Page Traffic
This is your top-of-funnel, your first handshake with the world. Before anyone can buy your product, they have to see it. Tracking traffic isn’t just about the total number of visitors; it’s about understanding who they are and how they found you.
What to Track:
- Total Unique Visitors: How many distinct people saw your message? This measures the total reach of your launch marketing.
- Traffic by Channel: This is the most critical part. Where did they come from?
- Direct: They typed your URL directly into their browser. This is a strong indicator of brand awareness and hype. People knew your name.
- Organic Search: They found you on Google. This shows your pre-launch SEO and content marketing efforts are paying off.
- Paid Search/Social: This is all your ad spend. It’s essential to know if your ads are actually generating clicks.
- Referral: They clicked a link from another website (like a press mention, a blog review, or a partner site). This measures the success of your PR and outreach.
- Social: They came from Twitter, LinkedIn, Facebook, and other platforms. This measures your social media buzz.
Why It Matters:
A high volume of traffic from “Paid Social” with very little from “Direct” or “Organic” tells you something important. It says your ads are working, but your brand hasn’t yet built its own gravity. You’re buying all your growth.
Conversely, a massive spike in “Referral” traffic tells you that the article on TechCrunch or the review from a key influencer had a considerable impact. This is a go-to-market metric that informs your future marketing strategy: “We should do more of that.”
2. Conversion Rates (Macro & Micro)
Okay, people are visiting your site. Now what?
A “conversion” is simply getting a user to take a desired action. Most people only think of the macro conversion: the sale. But this is shortsighted.
The path to a sale is paved with smaller “yes” moments. These are your micro conversions.
What to Track:
- Macro Conversion (Primary Goal):
- Purchase completed
- Subscription started
- Micro Conversions (Secondary Goals):
- Email newsletter signup
- Free trial started
- Demo request submitted
- Account creation (even if it’s free)
- “Add to Cart” (even if they abandoned it)
- Downloaded a whitepaper or case study
Why It Matters:
Your product launch might be a massive success at generating leads, even if sales are slow.
Imagine your macro conversion rate (sales) is a low 0.5%. Disappointing, right? But what if your micro conversion rate (email newsletter signup) is 25%? That’s phenomenal.
You didn’t fail. You just successfully identified a 24.5% segment of your audience that is interested but not yet convinced. You now have a massive, warm audience to nurture with emails, case studies, and special offers. Without tracking micro-conversions, you would have incorrectly labeled your launch a failure.
3. Customer Acquisition Cost (CAC)
This is, without a doubt, one of the most essential product launch metrics. It’s the guardrail that keeps your business from driving off a cliff.
Customer Acquisition Cost (CAC) refers to the total amount of money spent to acquire one new, paying customer.
How to Calculate It:
The basic formula is simple:
Total Sales & Marketing Spend / Number of New Customers Acquired = CAC
Be honest with the “Total Spend” part. It includes:
- Ad spend (Google, Facebook, LinkedIn, etc.)
- Influencer fees
- PR agency costs
- Content creation costs (if you hired writers/designers)
- A portion of your team’s salary (if they are dedicated to marketing/sales)
Why It Matters:
CAC tells you if your business model is viable. It’s one half of the most essential equation in business: CLV > CAC (Customer Lifetime Value must be greater than Customer Acquisition Cost).
If you spent $50,000 on your launch marketing and got 500 new customers, your CAC is $100.
- If your product is a $30 ebook, you have a massive problem. You are losing $70 on every single customer.
- If your product is a $1,000/year enterprise software subscription, you are a genius. You’re spending $100 to make $1,000.
A successful launch isn’t just about getting customers; it’s about getting them profitably. A high CAC right at launch is standard, as you’re spending a lot on awareness. But you must track this number and have a clear plan to reduce it over time through optimization and organic growth.
4. User Engagement & Activation Metrics
This is where we distinguish marketing success from product success. People bought your product. Hooray!
Now… are they using it?
This is more important than revenue. High revenue with low engagement means you’re skilled at marketing but struggle with building a product. That’s a “leaky bucket,” and those customers will all churn. These user engagement metrics indicate whether the product has achieved product-market fit.
What to Track:
- Activation Rate: This is your “Aha!” moment. An “activated” user is someone who has completed the key action that delivers the core value of your product.
- For Dropbox, it involved adding a single file to a folder on a specific device.
- For Facebook, it was adding seven friends in 10 days.
- For your SaaS, it might be “created their first project” or “invited a teammate.”
You must define this. The metric is calculated as follows: (Number of Activated Users / Number of New Signups) × 100.
- DAU/MAU (Daily Active Users / Monthly Active Users): This is your “stickiness” ratio. It tells you how often people come back. If you have 1,000 Monthly Active Users (MAU) but only 50 Daily Active Users (DAU), your DAU/MAU ratio is 5%. This means people are using your product, but not compulsively. For a social media app, that’s terrible. For a tax-filing software, it’s perfectly fine. Context is key.
- Feature Adoption Rate: Your launch probably included three amazing new features. Are people using them? This metric ((Number of users who used Feature X / Total Users) * 100) tells you what’s a hit and what’s a miss. If nobody is using your “flagship” new feature, it’s a sign that it’s either poorly designed, hard to find, or simply not valuable.
- Session Duration: How long are people staying when they log in? Longer sessions usually (but not always) mean higher engagement.
Why It Matters:
These product launch analytics are your earliest and most accurate indicators of long-term success. A high activation rate is the best predictor of low churn. It proves your product delivers on its promise. If your activation rate is low, all your efforts should immediately shift from marketing to improving your user onboarding.
5. Early Churn Rate
The churn rate is the percentage of customers who cancel or leave within a specific time period (e.g., the first week, first 30 days).
You might think it’s too early to measure this, but early churn is your loudest alarm bell.
What to Track:
- 7-Day Churn: Of all the users who signed up in Week 1, how many canceled by Day 7?
- 30-Day Churn: Of all the users who signed up in Month 1, how many canceled by Day 30?
- Failed Trial-to-Paid Conversions: This represents the percentage of users who fail to convert from a free trial to a paid subscription. Rate: How many people started a trial and didn’t convert to a paid plan?
Why It Matters:
Early churn is a direct, brutal feedback mechanism. It’s a customer saying, “I tried your product, and it was not worth the money/time.”
- It could mean your marketing was misleading. You promised a magic bullet, but the product was just a regular gun. The customer feels betrayed.
- It could mean your onboarding is terrible. The product is excellent, but the user got confused, frustrated, and left.
- It could mean your product is buggy or missing a critical feature.
While a 0% churn rate is impossible, a high early churn rate (e.g., over 10% in the first 30 days) is a serious concern. It doesn’t matter how many new customers you acquire if you can’t keep them. You must pause, survey the churned users (asking them why they left), and address the core problem.
6. Social Listening & Brand Sentiment
Your launch isn’t just happening on your website. It’s happening on Twitter, LinkedIn, Reddit, and Facebook. Social listening KPIs measure the conversation around your brand.
This isn’t just about vanity. It’s about capturing priceless, unfiltered customer feedback.
What to Track:
- Volume of Mentions: How many times was your brand or product name mentioned? Use tools like Brand24, Mention, or even just TweetDeck to track this. You’re looking for a spike during launch week.
- Sentiment Analysis: This is the magic. Are the mentions positive, negative, or neutral?
- Positive: “Just tried the new [Product] and it’s a game-changer! ” (This is marketing gold).
- Negative: “Trying to sign up for [Product] and the server keeps crashing. So frustrating.” (This is an urgent support ticket).
- Neutral/Confused: “Not sure I understand what [Product] does that [Competitor] doesn’t.” (This is a messaging problem you need to fix).
- Share of Voice (SOV): How much of the conversation in your industry is about you versus your competitors? During launch week, you want to dominate this.
Why It Matters:
Social listening is your real-time focus group. It allows you to:
- Find bugs faster: Users will complain on Twitter before they ever file a support ticket.
- Amplify positive feedback: You can find and share user-generated content (UGC) and testimonials to support your brand and enhance its credibility.
- Address confusion: If 20 people on Reddit are all asking the same question about your pricing, your pricing page is confusing. Fix it.
This qualitative data is just as important as the quantitative sales data.
7. Net Promoter Score (NPS)
NPS is a classic metric for a reason. It is the single best way to measure customer satisfaction and loyalty with a straightforward question:
“On a scale of 0-10, how likely are you to recommend [Your Product] to a friend or colleague?”
Based on their answer, you group users into three buckets:
- Promoters (9-10): These are your loyal fans. They will evangelize for you.
- Passives (7-8): They’re satisfied but not enthusiastic. They’re vulnerable to competitor offers.
- Detractors (0-6): They are unhappy. They are at high risk of churning and may even spread negative word of mouth.
How to Calculate It:
Your NPS = % Promoters – % Detractors
So, if you have 60% Promoters and 10% Detractors, your NPS is 50. (Which is considered excellent).
Why It Matters:
You should send an NPS survey to your new users about 7-14 days after they sign up.
- It gives you a single, benchmarkable score to track over time.
- The real value comes from the follow-up question: “Why did you give that score?”
- The answers from promoters reveal your core value. (“It’s so easy to use!”)
- The answers from detractors provide your urgent fix-it list. (“The reporting feature is useless.”)
NPS is a leading indicator of both future churn (from Detractors) and future growth (from Promoters).
8. Lead Generation & Pipeline Velocity
This is especially crucial for B2B, SaaS, or high-ticket B2C products with long sales cycles. The launch isn’t about the final sale. It’s about filling the pipeline.
Success is not measured in dollars, but in demos booked.
What to Track:
- Marketing Qualified Leads (MQLs): How many people downloaded a guide, signed up for a webinar, or fit your ideal customer profile? This is the total number of “hand-raisers.”
- Sales Qualified Leads (SQLs): How many of those MQLs were vetted by your sales team and deemed worthy of a direct conversation?
- MQL-to-SQL Conversion Rate: This measures the quality of your launch leads. If you get 1,000 MQLs but only 10 become SQLs (a 1% conversion rate), your marketing is attracting the wrong audience.
- Pipeline Velocity: How fast are new leads moving from first touch (MQL) to a sales opportunity (SQL)? A successful launch will have a high-velocity pipeline.
Why It Matters:
For a B2B company, a launch that generates zero immediate sales but books 200 demos with qualified leads is a runaway success. That launch just provided the sales team with an entire quarter’s worth of work.
This is a classic example of how “revenue-only” thinking fails. The revenue from this launch won’t be reflected for 60-90 days, but the success was evident from Day 1.
9. Customer Lifetime Value (CLV) (Early Projections)
This is the other half of the CAC equation. Customer Lifetime Value (CLV or LTV) is the total revenue you expect to generate from a single customer over the entire time they’re with you.
It’s hard to measure this at launch, but you must start making projections.
How to Calculate It (Simplified):
CLV = (Average Purchase Value * Average Purchase Frequency) * Average Customer Lifespan
For a subscription, it’s simpler:
CLV = (Average Monthly Revenue Per User / Monthly Churn Rate)
Why It Matters:
At launch, you’re tracking leading indicators of CLV:
- Upsell/Cross-sell Rate: Are your new customers buying more? Are they upgrading from your “Basic” plan to your “Pro” plan? This is a vast, positive sign.
- Average Order Value (AOV): Is the average new customer spending $50 or $75?
- Referral Rate: Are they bringing in friends? (More on this next).
You need to know your CLV (or a reasonable estimate) so you can understand how much you can afford to spend to acquire a customer. If your early cohort data shows a high upsell rate and low churn, your CLV projection goes up. This means you can increase your CAC and spend more on ads to grow even faster.
Without CLV, your CAC number has no context.
10. The Viral Coefficient (K-factor)
We’ve saved the most powerful for last.
All the metrics above relate to your efforts, including your ads, product, and sales team.
The Viral Coefficient measures growth that happens without you. It measures the number of new customers each existing customer generates. This is the engine of word-of-mouth.
It’s known as the K-factor.
How to Calculate It:
K = i * c
- i = Invitations: The average number of invitations (or shares) sent by each existing customer.
- c = Conversion Rate: The percentage of those invitations that turn into a new customer.
Example:
- Your new product launches, and 100 people sign up.
- On average, each of those 100 users invites five friends (i = 5).
- That’s 500 total invitations.
- Of those 500 invites, 10% actually sign up (c = 0.10).
- You just got 50 new customers (500 * 0.10).
- Your K-factor is: 5 * 0.10 = 0.5
This means that for every two customers you acquire, you will gain one more… for free.
Why It Matters:
The K-factor is the key to exponential, sustainable growth.
- If K < 1 (e.g., 0.5): You have viral growth, but it’s finite. It will eventually die out. This is still great, as it lowers your average CAC.
- If K > 1 (e.g., 1.2): This is the holy grail. This is exponential growth. Every customer brings in 1.2 more customers. Those 1.2 customers then bring in 1.44 customers, and so on. This is how Dropbox, Facebook, and Hotmail grew into giants.
Measuring your viral coefficient is the single best way to understand the true reach and word-of-mouth success of your product launch. It’s the ultimate go-to-market metric.
But there’s a problem. It’s tough to track.
How to Actually Track Your True Viral Growth
Most teams try to track their K-factor manually. They try to patch together “how did you hear about us?” forms, UTM parameters, and messy spreadsheets. It’s a nightmare.
You can’t see who your real ambassadors are. You don’t know if the invites sent via email convert better than those sent via Twitter. You’re flying blind.
This is precisely why a dedicated platform is so essential for measuring this. A tool like Viral Loops is explicitly designed to build, manage, and—most importantly—measure referral programs and viral campaigns.
Instead of guessing, the Viral Loops dashboard gives you a crystal-clear view of your word-of-mouth metrics. It’s designed to provide deep insights into the true success of your launch.
You can instantly see:
- Your real-time Viral Coefficient (K-factor).
- Total participants (how many users joined your referral program).
- Total referrals (how many new, qualified leads were generated).
- Conversion rates per channel (what’s more effective: Facebook, email, or a direct link?).
- Who your top referrers are, so you can reward your most passionate ambassadors.
A product launch analytics dashboard that ignores word-of-mouth is only showing you half the story. The real success isn’t just the customers you bought; it’s the customers they brought. By using a tool like Viral Loops, you’re not just hoping for virality; you’re engineering and measuring it, turning word-of-mouth from a mystery into a reliable growth channel.
Conclusion: Stop Staring at Sales, Start Seeing the System
Measuring product launch success is not about a single number. It’s about understanding a complex, interconnected system.
- Traffic and Conversion Rates tell you if your message is working.
- CAC and CLV tell you if your business model is working.
- Engagement and Churn tell you if your product is working.
- NPS and Social Sentiment tell you what your customers are feeling.
- And the Viral Coefficient tells you if your growth is sustainable.
Your revenue on launch day is the result of all these other factors. If you only focus on the result, you’ll never know how to fix the system.
Stop refreshing the sales page. Build a real dashboard. Start tracking the 10 KPIs that actually matter, and get a clear-eyed view of your word-of-mouth potential. That is how you make a business that doesn’t just launch, but lasts.
Frequently Asked Questions (FAQs)
Q: What is a good viral coefficient (K-factor)?
A: Honestly, any K-factor greater than 0 is “good” because it means you’re getting free customers and lowering your overall CAC. A K-factor between 0.2 and 0.5 is considered very solid. A K-factor greater than 1.0 is the “holy grail” that leads to exponential, viral growth. But don’t be discouraged if you’re not at 1.0; a K of 0.3 is still a powerful growth lever.
Q: How soon after launch should I start measuring these KPIs?
A: Immediately.
- Day 1: Track Traffic, Conversion Rates (micro & macro), Social Mentions, and CAC.
- Week 1: Begin examining Activation Rate, Feature Adoption, and 7-Day Churn.
- Week 2-4: Send your first NPS surveys. Start calculating your 30-Day Churn and making your first CLV projections.
- The Viral Coefficient should be tracked from Day 1, as soon as a referral mechanism is in place.
Q: What’s the difference between a “metric” and a “KPI”?
A: This is a great question. They’re often used interchangeably, but there’s a key difference.
- A Metric is just a number. “We had 10,000 website visitors.”
- A KPI (Key Performance Indicator) is a metric that is tied directly to a strategic goal. “Our goal is to acquire 500 new customers this month. Therefore, our KPI is the conversion rate from visitor to customer.”
All KPIs are metrics, but not all metrics are KPIs. Don’t track 100 metrics; pick the 5-10 KPIs that are key to your success.
Q: Is revenue ever the most critical product launch metric?
A: Yes, in some specific contexts. If you’re launching a one-time product (such as a book, a movie, or a single-purchase hardware item) and your primary goal is profit, then launch-week revenue is an excellent KPI.